TyT2019W17 - Is There a Relation?
By Johanie Fournier, agr. in rstats tidyverse tidytuesday
April 23, 2019
Get the data
tidy_anime <- readr::read_csv("https://raw.githubusercontent.com/rfordatascience/tidytuesday/master/data/2019/2019-04-23/tidy_anime.csv")
## Rows: 77911 Columns: 28
## ── Column specification ────────────────────────────────────────────────────────
## Delimiter: ","
## chr  (17): name, title_english, title_japanese, title_synonyms, type, source...
## dbl   (8): animeID, episodes, score, scored_by, rank, popularity, members, f...
## lgl   (1): airing
## date  (2): start_date, end_date
##
## ℹ Use `spec()` to retrieve the full column specification for this data.
## ℹ Specify the column types or set `show_col_types = FALSE` to quiet this message.
Explore the data
summary(tidy_anime)
##     animeID          name           title_english      title_japanese
##  Min.   :    1   Length:77911       Length:77911       Length:77911
##  1st Qu.: 3052   Class :character   Class :character   Class :character
##  Median :13667   Mode  :character   Mode  :character   Mode  :character
##  Mean   :16863
##  3rd Qu.:31452
##  Max.   :39197
##
##  title_synonyms         type              source           producers
##  Length:77911       Length:77911       Length:77911       Length:77911
##  Class :character   Class :character   Class :character   Class :character
##  Mode  :character   Mode  :character   Mode  :character   Mode  :character
##
##
##
##
##     genre              studio             episodes         status
##  Length:77911       Length:77911       Min.   :   1.0   Length:77911
##  Class :character   Class :character   1st Qu.:   1.0   Class :character
##  Mode  :character   Mode  :character   Median :  12.0   Mode  :character
##                                        Mean   :  15.8
##                                        3rd Qu.:  13.0
##                                        Max.   :3057.0
##                                        NA's   :987
##    airing          start_date            end_date            duration
##  Mode :logical   Min.   :1917-01-01   Min.   :1962-02-02   Length:77911
##  FALSE:76528     1st Qu.:2002-09-01   1st Qu.:2005-06-02   Class :character
##  TRUE :1383      Median :2011-01-22   Median :2012-06-02   Mode  :character
##                  Mean   :2007-03-14   Mean   :2009-03-29
##                  3rd Qu.:2015-09-18   3rd Qu.:2016-03-02
##                  Max.   :2019-02-03   Max.   :2019-09-02
##                  NA's   :238          NA's   :33824
##     rating              score          scored_by            rank
##  Length:77911       Min.   : 1.000   Min.   :      0   Min.   :    1
##  Class :character   1st Qu.: 6.360   1st Qu.:    597   1st Qu.: 1530
##  Mode  :character   Median : 7.020   Median :   7130   Median : 3685
##                     Mean   : 6.894   Mean   :  43495   Mean   : 4557
##                     3rd Qu.: 7.550   3rd Qu.:  39876   3rd Qu.: 6724
##                     Max.   :10.000   Max.   :1107955   Max.   :13838
##                     NA's   :174
##    popularity       members          favorites        synopsis
##  Min.   :    1   Min.   :      6   Min.   :     0   Length:77911
##  1st Qu.: 1064   1st Qu.:   1968   1st Qu.:     2   Class :character
##  Median : 3033   Median :  18214   Median :    40   Mode  :character
##  Mean   : 4567   Mean   :  85051   Mean   :  1468
##  3rd Qu.: 7394   3rd Qu.:  88560   3rd Qu.:   413
##  Max.   :15474   Max.   :1610561   Max.   :120331
##
##   background         premiered          broadcast           related
##  Length:77911       Length:77911       Length:77911       Length:77911
##  Class :character   Class :character   Class :character   Class :character
##  Mode  :character   Mode  :character   Mode  :character   Mode  :character
##
##
##
##
Prepare the data
data<-tidy_anime%>%
  select(name, start_date, score, rating, popularity)%>%
  filter(!is.na(start_date) & !is.na(score))%>%
  filter(!rating=="None")%>%
  distinct()
Visualize the data
#Graphique
gg<-ggplot(data=data, aes(x=popularity, y=score))
gg<-gg + geom_point(size=2, color=alpha("#80FF72", 0.1))
gg<-gg + geom_smooth(size=2.5, color="#E8EBE4")
#ajuster les axes
#gg<-gg + scale_y_continuous(breaks=seq(1,7,1), limits = c(1, 7))
gg<-gg + scale_x_continuous(breaks=seq(0, 18000, 2000),limits = c(0, 16000))
#gg<-gg + expand_limits(x =c(-2,16))
#modifier la légende
gg<-gg + theme(legend.position="none")
#modifier le thème
gg<-gg +theme(panel.border = element_blank(),
panel.background = element_rect(fill = "#292E1E", colour = "#292E1E"),
plot.background = element_rect(fill = "#292E1E", colour = "#292E1E"),
panel.grid.major.y= element_blank(),
panel.grid.major.x= element_blank(),
panel.grid.minor = element_blank(),
axis.line = element_line(size=1, color="#E8EBE4", linetype="solid"),
axis.ticks= element_line(size=0.5, color="#E8EBE4", linetype="solid"))
#ajouter les titres
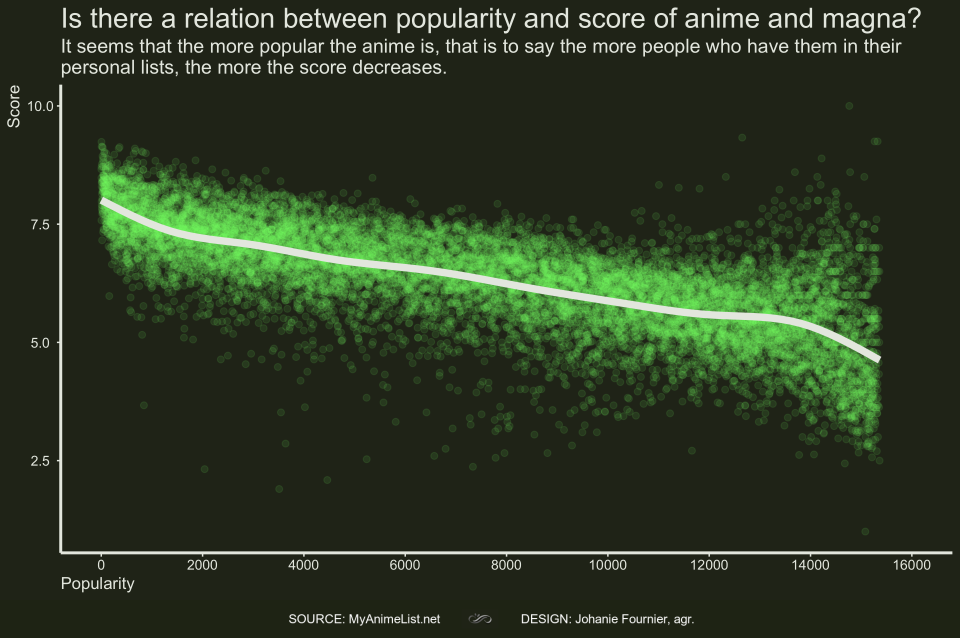
gg<-gg + labs(title="Is there a relation between popularity and score of anime and magna?",
subtitle="It seems that the more popular the anime is, that is to say the more people who have them in their\npersonal lists, the more the score decreases.",
y="Score",
x="Popularity")
gg<-gg + theme(plot.title = element_text(hjust=0,size=20, color="#E8EBE4"),
plot.subtitle = element_text(hjust=0,size=14, color="#E8EBE4"),
axis.title.y = element_text(hjust=1, size=12, color="#E8EBE4"),
axis.title.x = element_text(hjust=0, size=12, color="#E8EBE4"),
axis.text.y = element_text(hjust=0.5, size=10, color="#E8EBE4"),
axis.text.x = element_text(hjust=0.5, size=10, color="#E8EBE4"))
- Posted on:
- April 23, 2019
- Length:
- 3 minute read, 593 words
- Categories:
- rstats tidyverse tidytuesday
- Tags:
- rstats tidyverse tidytuesday