Get the data
hotels <- readr:: read_csv ("https://raw.githubusercontent.com/rfordatascience/tidytuesday/master/data/2020/2020-02-11/hotels.csv" )
## Rows: 119390 Columns: 32
## ── Column specification ────────────────────────────────────────────────────────
## Delimiter: ","
## chr  (13): hotel, arrival_date_month, meal, country, market_segment, distrib...
## dbl  (18): is_canceled, lead_time, arrival_date_year, arrival_date_week_numb...
## date  (1): reservation_status_date
##
## ℹ Use `spec()` to retrieve the full column specification for this data.
## ℹ Specify the column types or set `show_col_types = FALSE` to quiet this message.
Explore the data
## Rows: 119,390
## Columns: 32
## $ hotel                          <chr> "Resort Hotel", "Resort Hotel", "Resort…
## $ is_canceled                    <dbl> 0, 0, 0, 0, 0, 0, 0, 0, 1, 1, 1, 0, 0, …
## $ lead_time                      <dbl> 342, 737, 7, 13, 14, 14, 0, 9, 85, 75, …
## $ arrival_date_year              <dbl> 2015, 2015, 2015, 2015, 2015, 2015, 201…
## $ arrival_date_month             <chr> "July", "July", "July", "July", "July",…
## $ arrival_date_week_number       <dbl> 27, 27, 27, 27, 27, 27, 27, 27, 27, 27,…
## $ arrival_date_day_of_month      <dbl> 1, 1, 1, 1, 1, 1, 1, 1, 1, 1, 1, 1, 1, …
## $ stays_in_weekend_nights        <dbl> 0, 0, 0, 0, 0, 0, 0, 0, 0, 0, 0, 0, 0, …
## $ stays_in_week_nights           <dbl> 0, 0, 1, 1, 2, 2, 2, 2, 3, 3, 4, 4, 4, …
## $ adults                         <dbl> 2, 2, 1, 1, 2, 2, 2, 2, 2, 2, 2, 2, 2, …
## $ children                       <dbl> 0, 0, 0, 0, 0, 0, 0, 0, 0, 0, 0, 0, 0, …
## $ babies                         <dbl> 0, 0, 0, 0, 0, 0, 0, 0, 0, 0, 0, 0, 0, …
## $ meal                           <chr> "BB", "BB", "BB", "BB", "BB", "BB", "BB…
## $ country                        <chr> "PRT", "PRT", "GBR", "GBR", "GBR", "GBR…
## $ market_segment                 <chr> "Direct", "Direct", "Direct", "Corporat…
## $ distribution_channel           <chr> "Direct", "Direct", "Direct", "Corporat…
## $ is_repeated_guest              <dbl> 0, 0, 0, 0, 0, 0, 0, 0, 0, 0, 0, 0, 0, …
## $ previous_cancellations         <dbl> 0, 0, 0, 0, 0, 0, 0, 0, 0, 0, 0, 0, 0, …
## $ previous_bookings_not_canceled <dbl> 0, 0, 0, 0, 0, 0, 0, 0, 0, 0, 0, 0, 0, …
## $ reserved_room_type             <chr> "C", "C", "A", "A", "A", "A", "C", "C",…
## $ assigned_room_type             <chr> "C", "C", "C", "A", "A", "A", "C", "C",…
## $ booking_changes                <dbl> 3, 4, 0, 0, 0, 0, 0, 0, 0, 0, 0, 0, 0, …
## $ deposit_type                   <chr> "No Deposit", "No Deposit", "No Deposit…
## $ agent                          <chr> "NULL", "NULL", "NULL", "304", "240", "…
## $ company                        <chr> "NULL", "NULL", "NULL", "NULL", "NULL",…
## $ days_in_waiting_list           <dbl> 0, 0, 0, 0, 0, 0, 0, 0, 0, 0, 0, 0, 0, …
## $ customer_type                  <chr> "Transient", "Transient", "Transient", …
## $ adr                            <dbl> 0.00, 0.00, 75.00, 75.00, 98.00, 98.00,…
## $ required_car_parking_spaces    <dbl> 0, 0, 0, 0, 0, 0, 0, 0, 0, 0, 0, 0, 0, …
## $ total_of_special_requests      <dbl> 0, 0, 0, 0, 1, 1, 0, 1, 1, 0, 0, 0, 3, …
## $ reservation_status             <chr> "Check-Out", "Check-Out", "Check-Out", …
## $ reservation_status_date        <date> 2015-07-01, 2015-07-01, 2015-07-02, 20…
hotels %>%
count (hotel) %>%
knitr:: kable ()
hotel
n
City Hotel
79330
Resort Hotel
40060
hotels %>%
count (arrival_date_year) %>%
knitr:: kable ()
arrival_date_year
n
2015
21996
2016
56707
2017
40687
hotels %>%
count (arrival_date_week_number) %>%
knitr:: kable ()
arrival_date_week_number
n
1
1047
2
1218
3
1319
4
1487
5
1387
6
1508
7
2109
8
2216
9
2117
10
2149
11
2070
12
2083
13
2416
14
2264
15
2689
16
2405
17
2805
18
2926
19
2402
20
2785
21
2854
22
2546
23
2621
24
2498
25
2663
26
2391
27
2664
28
2853
29
2763
30
3087
31
2741
32
3045
33
3580
34
3040
35
2593
36
2167
37
2229
38
2661
39
2581
40
2397
41
2699
42
2756
43
2352
44
2272
45
1941
46
1574
47
1685
48
1504
49
1782
50
1505
51
933
52
1195
53
1816
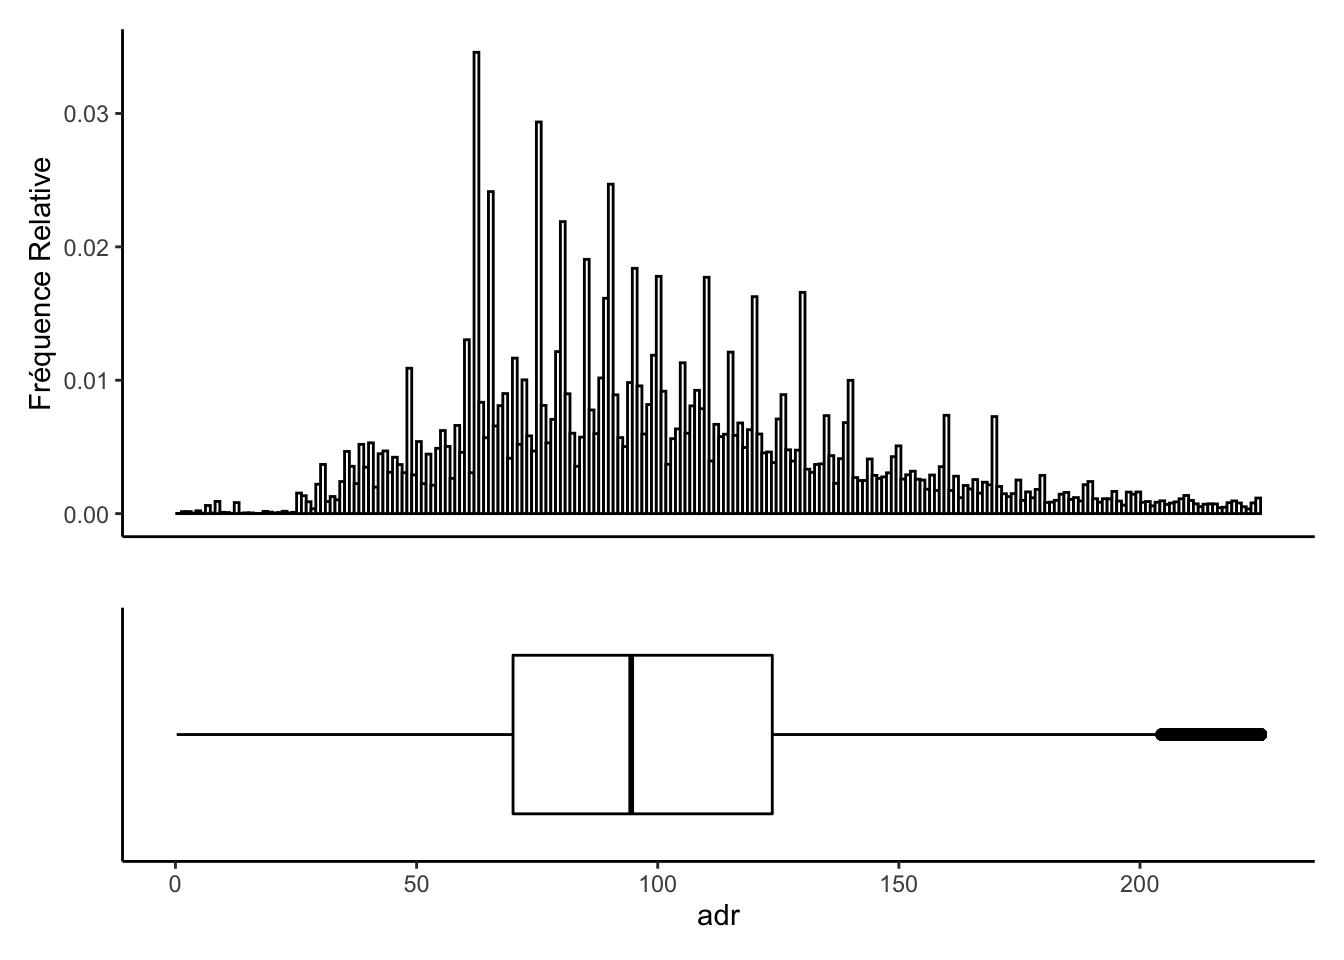
plt1 <- hotels %>%
filter (adr<= 225 , adr> 0 ) %>%
ggplot (aes (x= " " , y = adr)) +
geom_boxplot (fill = "#FFFFFF" , color = "black" ) +
coord_flip () +
theme_classic () +
xlab ("" ) +
ylab ("adr" )+
theme (axis.text.y= element_blank (),
axis.ticks.y= element_blank ())
plt2 <- hotels %>%
filter (adr<= 225 , adr> 0 ) %>%
ggplot () +
geom_histogram (aes (x = adr, y = (..count..)/ sum (..count..)),
position = "identity" , binwidth = 1 ,
fill = "#FFFFFF" , color = "black" ) +
ylab ("Fréquence Relative" )+
xlab ("" )+
theme_classic ()+
theme (axis.text.x = element_blank ())+
theme (axis.ticks.x = element_blank ())
plt2 + plt1 + plot_layout (nrow = 2 , heights = c (2 , 1 ))
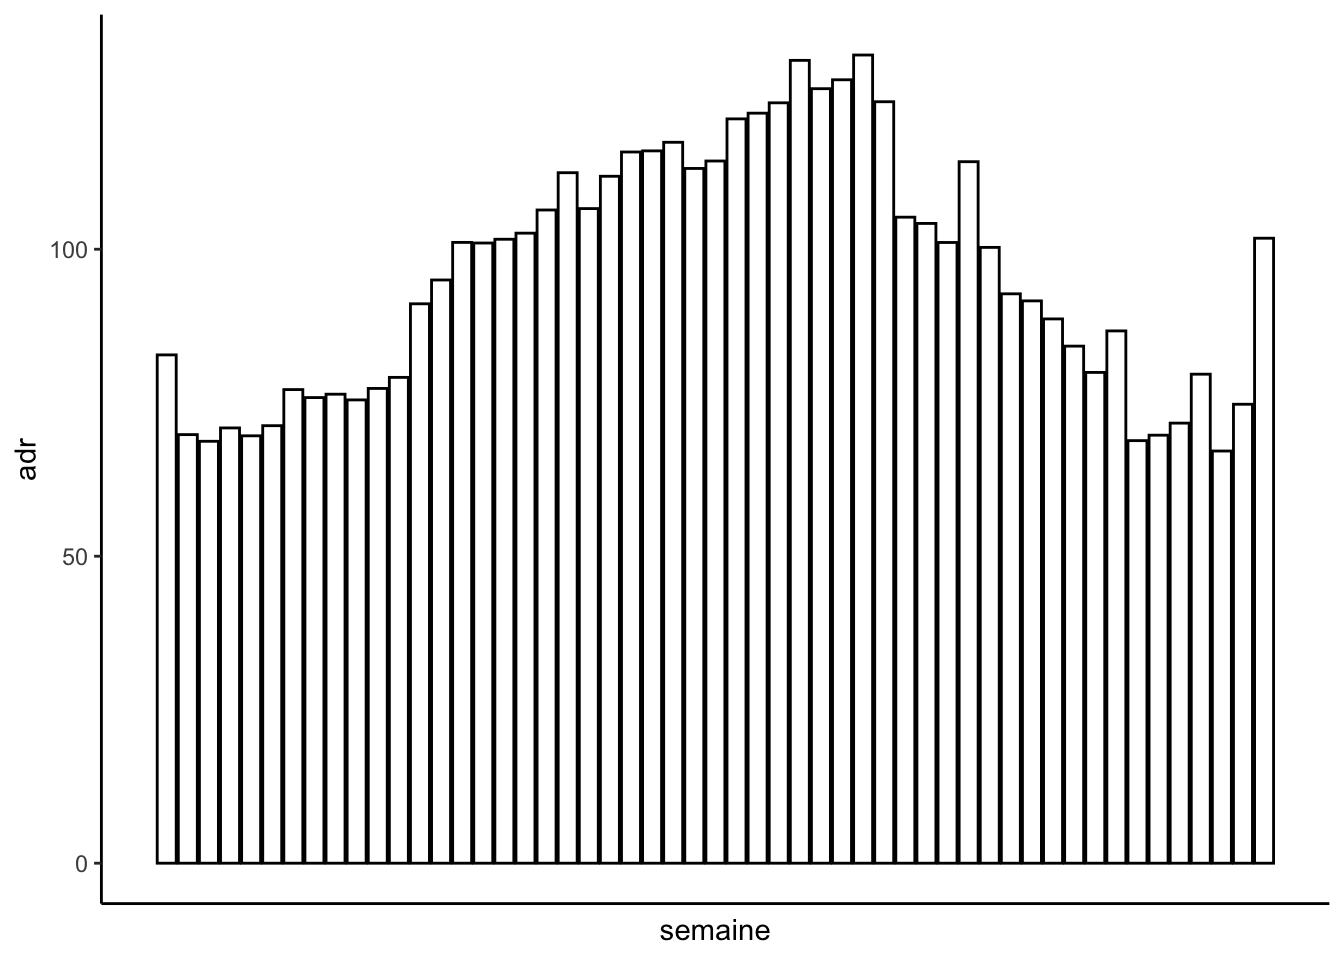
plt3 <- hotels %>%
filter (adr<= 225 , adr> 0 ) %>%
select (arrival_date_week_number, adr) %>%
group_by (arrival_date_week_number) %>%
summarise (mean_adr= mean (adr)) %>%
ggplot (aes (y = mean_adr, x = arrival_date_week_number, group= 1 ,fill= 1 )) +
geom_bar (fill = "#FFFFFF" , color = "black" , stat = "identity" ) +
ylab ("adr" )+
xlab ("semaine" )+
theme_classic ()+
theme (axis.text.x = element_blank ())+
theme (axis.ticks.x = element_blank ())
plt3
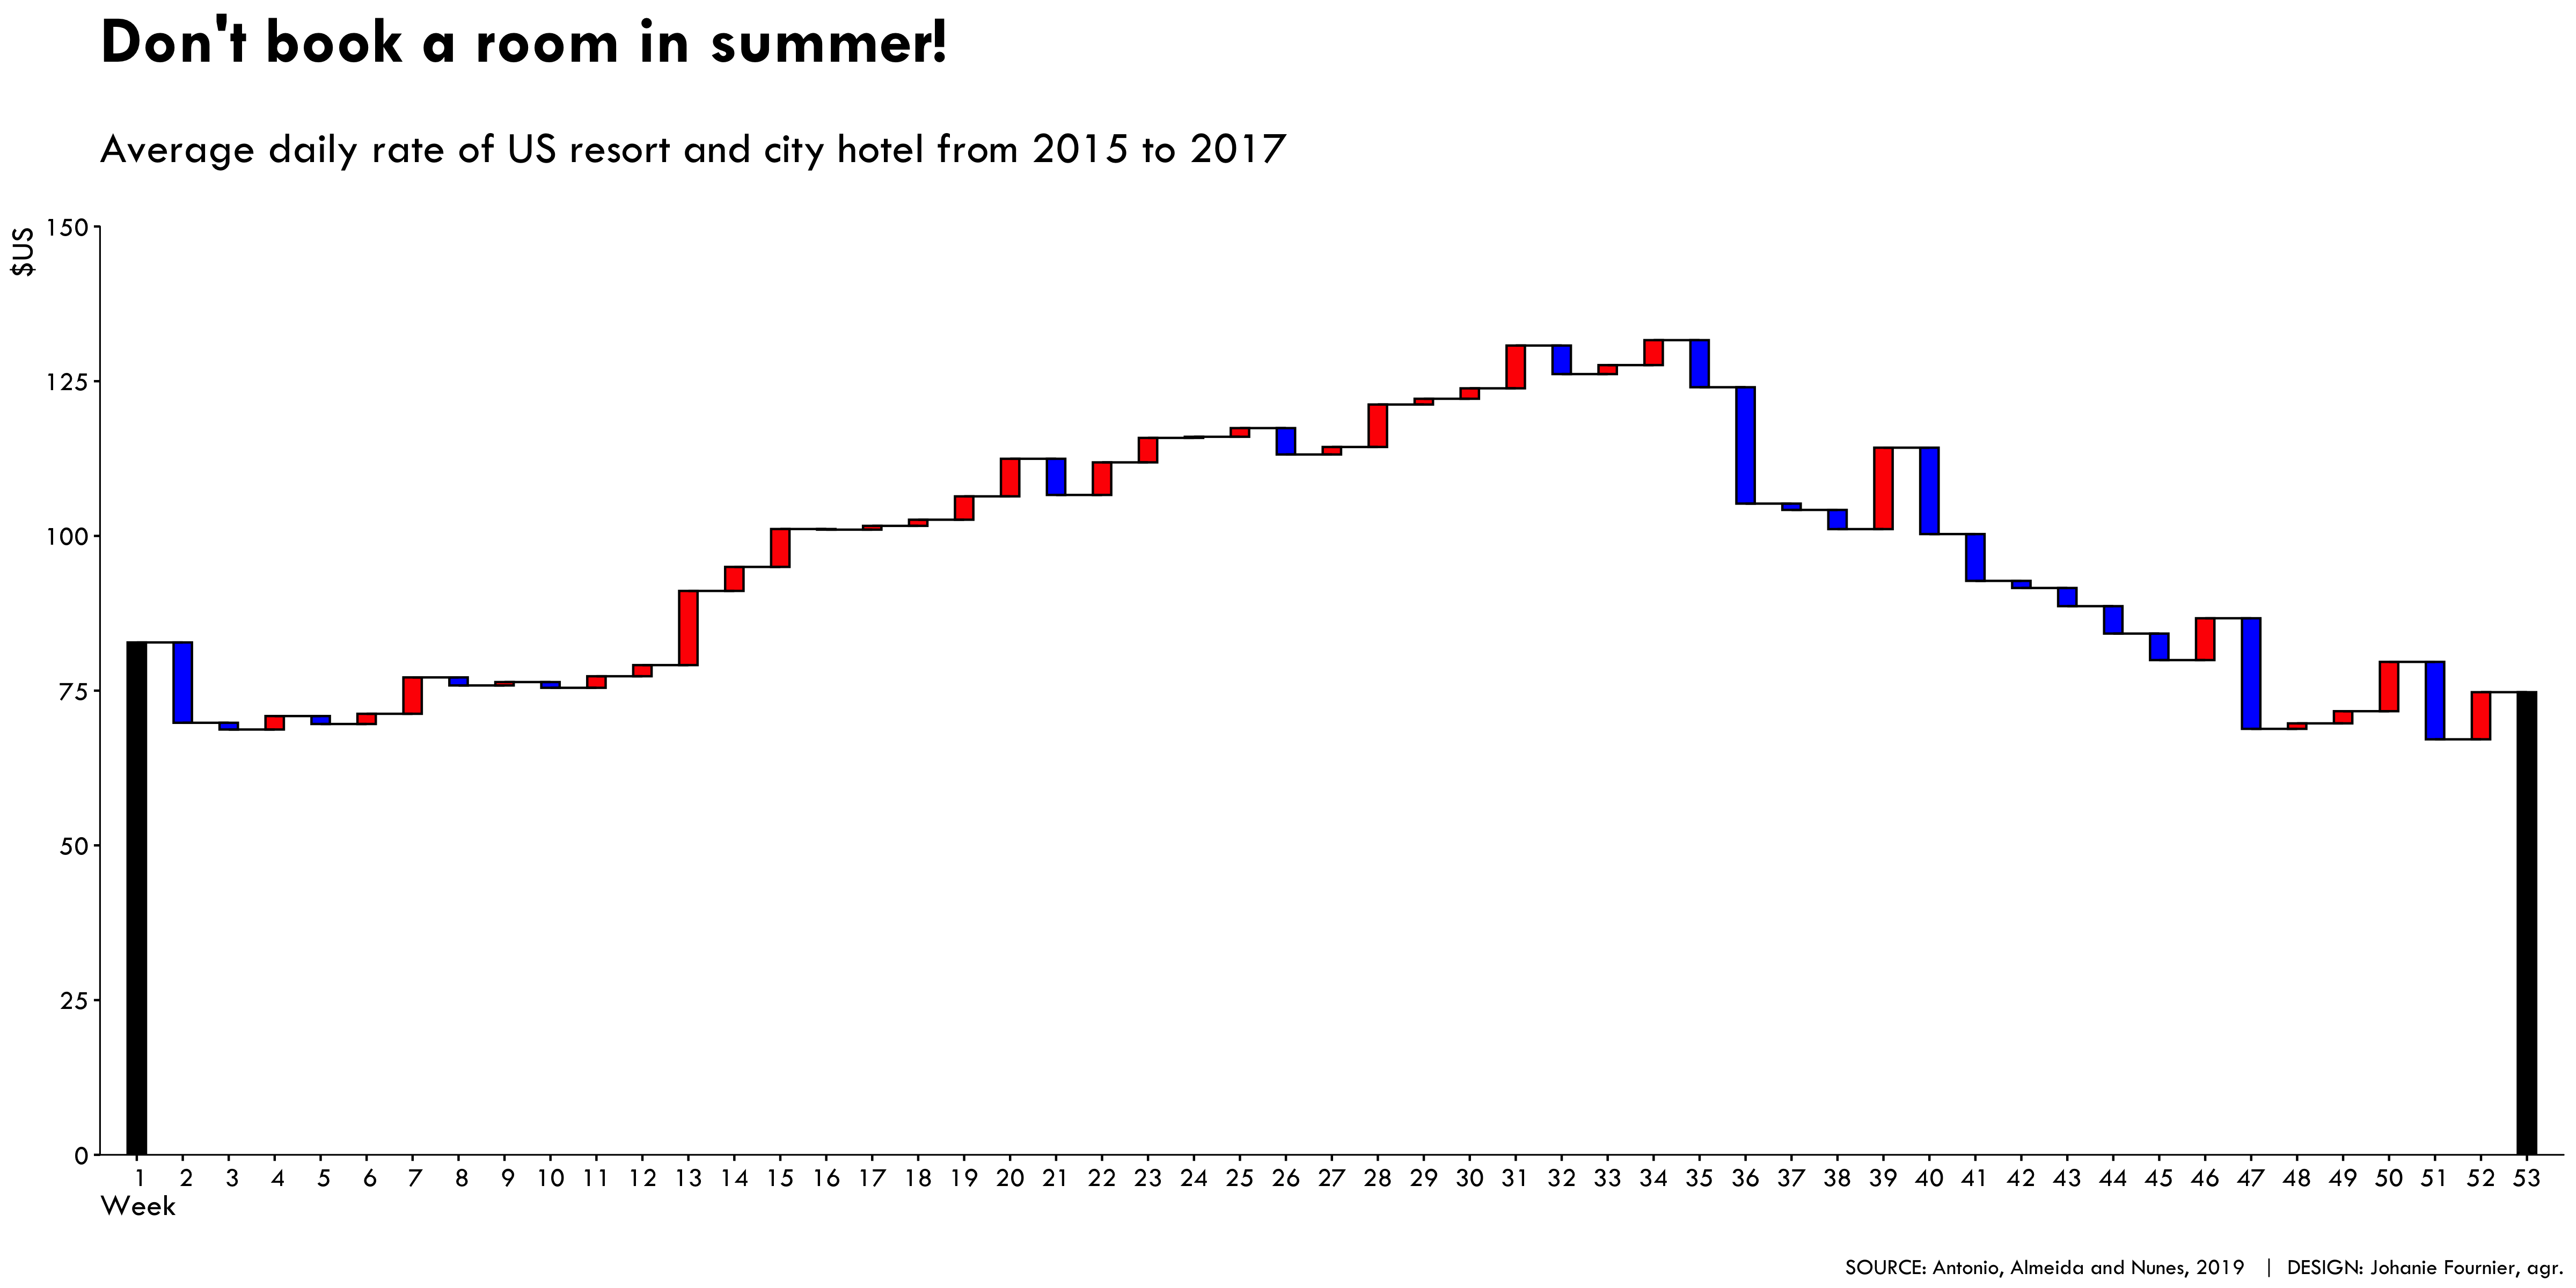
Prepare the data
data<- hotels %>%
filter (adr<= 225 , adr> 0 ) %>%
select (arrival_date_week_number, adr) %>%
group_by (arrival_date_week_number) %>%
summarise (mean_adr= mean (adr))
df<- hotels %>%
filter (adr<= 225 , adr> 0 ) %>%
select (arrival_date_week_number, adr) %>%
group_by (arrival_date_week_number) %>%
summarise (mean_adr= mean (adr)) %>%
mutate (lag_adr= lag (mean_adr), dif_adr= mean_adr- lag_adr) %>%
mutate (dif_adr= if_else (arrival_date_week_number== 1 , mean_adr, dif_adr)) %>%
select (arrival_date_week_number, dif_adr) %>%
rename (Category= arrival_date_week_number, Value= dif_adr)
levels <- df$ Category
data1 <- df %>%
mutate (Category = factor (Category, levels = levels),
ymin = round (cumsum (Value), 3 ),
ymax = lag (cumsum (Value), default = 0 ),
xmin = c (head (Category, -1 ), NA ),
xmax = c (tail (Category, -1 ), NA ),
Impact = ifelse (Category %in% c (as.character (df$ Category[1]), as.character (df$ Category[nrow (df)])),"Start" ,
ifelse (Value > 0 , "Increase" , "Decrease" )
)) %>%
mutate (ymin= if_else (Category== 53 , 0 , ymin))
Visualize the data
#Graphique
g <- ggplot (data1) +
theme_bw ()+
theme (legend.position = "none" ,
#legend.title=element_blank(),
panel.grid = element_blank (),
panel.border= element_blank (),
axis.line.x = element_line (color= "black" ),
axis.line.y = element_line (color= "black" ),
axis.ticks.x = element_line (color= "black" ),
axis.ticks.y = element_line (color= "black" ),
axis.text.x = element_text (size= 12 ,angle = 0 , vjust = 0.5 ,family= "Tw Cen MT" , color= "black" ),
axis.text.y = element_text (size= 12 ,angle = 0 , vjust = 0.5 ,family= "Tw Cen MT" , color= "black" ),
axis.title.x = element_text (size= 14 , angle = 0 , hjust = 0 ,family= "Tw Cen MT" , color= "black" ),
axis.title.y = element_text (size= 14 , angle = 90 , hjust = 1 ,family= "Tw Cen MT" , color= "black" ),
plot.caption = element_text (size= 10 , hjust= 1 ,vjust= 0.5 , family= "Tw Cen MT" , color= "black" ),
plot.title= element_text (size= 30 , hjust= 0 ,vjust= 0.5 , family= "Tw Cen MT" , color= "black" , face= "bold" ),
plot.subtitle = element_text (size= 20 , hjust= 0 ,vjust= 0.5 , family= "Tw Cen MT" , color= "black" ))+
labs (y = "$US" ,
x = "Week" ,
title = "Don't book a room in summer!" ,
subtitle= "\nAverage daily rate of US resort and city hotel from 2015 to 2017\n" ,
caption= "\nSOURCE: Antonio, Almeida and Nunes, 2019 | DESIGN: Johanie Fournier, agr." )
w <- 0.4 #use to set width of bars
g <- g +
geom_rect (aes (xmin = as.integer (Category) - w/ 2 ,
xmax = as.integer (Category) + w/ 2 , ymin = ymin, ymax = ymax,
fill = Impact), colour = "black" ) +
scale_x_discrete (limits = levels) +
scale_fill_manual (values = (c ("Decrease" = "blue" , "Increase" = "red" , "Start" = "black" )))
g <- g +
geom_segment (data = data1[1: (nrow (data1) -1 ),],aes (x = xmin,
xend = xmax,
y = ymin,
yend = ymin))
g <- g +
scale_y_continuous (breaks= seq (0 , 150 , 25 ), limits= c (0 ,150 ), expand= c (0 ,0 ))
Posted on:
February 13, 2020
Length:
6 minute read, 1069 words
Categories:
rstats tidyverse tidytuesday
Tags:
rstats tidyverse tidytuesday
See Also:
TyT2025W19: Seismic Events at Mount Vesuvius Heatmap to Visualize Spatio-Temporal Data Side by side interactive map with {leaflet} and {leaflet.extras2}